

Analyzing Performance Issues
While using the system, users may encounter slowness and performance issues. The root causes of these issues vary based on usage patterns, application design, system resources, and external factors.
For the purposes of this guide, “slowness” is defined as an aspect of the application or platform not responding within an expected, defined range. For example:
- As an end user, page loads take longer than pre-defined SLAs or seems slow
- As a designer, Health Check or logs indicate a response time above the defined threshold
This guide is designed to help teams methodically investigate reported issues and identify root cause(s) by performing the following steps:
Document Issues
Your team needs detailed information about the performance issues in order to start the analysis process. A simple email stating that “the system is slow” is not actionable. In order to collect this information, your team must first provide guidance to end users on how to document performance issues. You may also need to train your support staff on how to collect this information. This ensures that the responding team has a sufficient level of information to quickly triage and analyze an issue.
The following list provides the minimum data points that should be collected by your support team or by the end users themselves when they experience a performance issue:
- Name of the user reporting the issue
- Username of user experiencing the issue
- URL of the Appian environment
- Date and time of issue
- User's environment (e.g. browser type and version, use of VPN/virtual desktop)
- Steps to reproduce the observed behavior, noting specific screens and/or record/reference IDs related to latency
- If the issue is experienced in a browser, recording of the network logs captured using the browser’s Developer Tools could be useful. See “How to generate a browser network capture (HAR) file” for more information
Encourage the person documenting the issue to be as detailed as possible: What is slow? How slow? What data did you enter?
Sample Issue Report
| Reporter | John Smith |
| Username | john.smith |
| Site URL | https://myapplication.domain.com/suite/sites/mysite |
| Time of issue | Between 10:00am and 10:30am EST |
| Environment | Windows 10, IE Edge - over VPN |
| Issue Summary / Reproduction Steps | I logged in as john.smith and executed the Create Record action from the Finance site. I filled out the "Enter Basic Information" screen with my name and address, and added 10 locations. I clicked Submit, and the system took approximately 30 seconds before displaying the second form ("Enter Additional Details"). I expected the second form to appear within 5 seconds. |
Triage Issues
Performance issues can occur anywhere in an application so the first thing to do is to triage and categorize the reported issues. Looking at the environment metrics in My Appian is a great place to start to determine if performance could be impacting the wider the platform.
First, confirm the validity of the usage patterns triggering the reported issue(s). Invalid usage might best be resolved through training or application guardrails rather than in-depth performance analysis and tuning.
Some example questions to help you decide this are:
- Do users have realistic expectations?
- Is the user seeing SLA violations for response times?
- Is the reported issue tied to an area of the application that is expected to run longer, such as a large report?
- Are users utilizing the system as intended? Can users do something they shouldn’t be able to do?
- Exporting millions of records, or processing extremely large file upload might not be expected or valid.
- If performance testing, is the test realistic?
- Poorly designed tests (i.e. higher than expected volume) may result in performance issues.
- See the Performance Testing Methodology for guidance on test creation and validation.
Analyze Issues
Initial Analysis
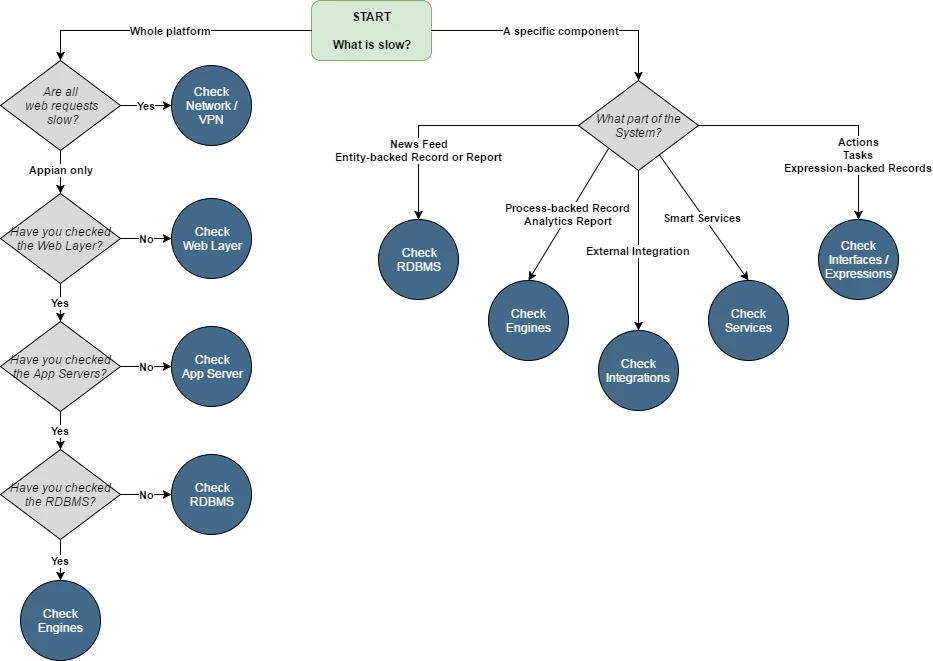
Once you've confirmed your application is not performing as expected, your first goal should be to isolate the problem to a specific area of your platform. Start by following the tree below. Once you have reached an endpoint, navigate to the appropriate section below for more information. Restart the decision tree as analysis dictates.
Detailed Analysis
Network/VPN
If all web interactions are slow, including those not associated with Appian, then your issue is likely related to your network connection or specific computer rather than the platform. Check these things first to confirm:
|
Key Questions |
Potential Issues |
Next Steps |
Relevant Logs And Tools |
|
Are you on VPN/Citrix, etc.? |
Latency is sometimes introduced by intermediate web proxies like VPN or Citrix |
|
|
|
Are your peers experiencing similar latency? |
Issues may be isolated to your machine or region |
|
|
Web Layer
If your web layer interactions are slow:
|
Key Questions |
Potential Issues |
Next Steps |
Relevant Logs And Tools |
|
Are nodes load balancing as expected? |
Load is imbalanced or otherwise not functioning correctly |
|
|
|
Is the Web Server performing as expected? |
Threads may be stuck, or CPU utilization may be too high for resources available |
|
|
|
Is granular debugging enabled? |
Some debugging levels introduce unexpected latency into Web requests |
|
|
App Server
|
Key Questions |
Potential Issues |
Next Steps |
Relevant Logs And Tools |
|
Is there high CPU utilization/load average? |
Application server resources are overloaded |
|
|
|
Is there high heap/garbage collection time? |
Application components are using a high amount of memory. Typically seen generating documents or working with very large data sets |
|
|
RDBMS
If your RDBMS interactions are slow:
|
Key Questions |
Potential Issues |
Next Steps |
Relevant Logs And Tools |
|
Are your queries designed efficiently? |
Queries are under/over indexed |
|
|
|
Are your queries running with the expected parameters? |
Indexes are not being applied correctly due to unexpected where conditions or casting to unexpected types |
|
|
|
Is the database tuned to support volume and type of queries? |
Database resources are insufficient; settings, such as buffer/cache are overwhelmed |
|
|
Engines
|
Key Questions |
Potential Issues |
Next Steps |
Relevant Logs And Tools |
|
Are all engines up? |
Some engines are not accessible, resulting in some requests failing or bottlenecking on limited resources |
|
|
|
Are your requests load balanced? |
Some execution services are being under- or over- utilized due to process design patterns |
|
|
|
Are engines overloaded? |
Engines are overloaded due to high utilization (either throughput or sub-optimal design) |
|
Interfaces/Expressions
If your interfaces are slow:
|
Key Questions |
Potential Issues |
Next Steps |
Relevant Logs And Tools |
|
Do your interfaces rely on external services or complex database queries? |
The service isn't performant or is not functioning correctly |
|
|
|
Are your interfaces complicated, or call many expressions? |
The time to complete numerous tasks causes the overall interface to perform slowly |
|
Integrations
If your external integrations are slow:
|
Key Questions |
Potential Issues |
Next Steps |
Relevant Logs And Tools |
|
Is there an issue in the service? |
The service isn't performant or is not functioning correctly |
|
|
|
Is there any issue with connectivity to the service? |
The network connection to the service is misconfigured |
|
|
Smart Services
If your smart service execution is slow:
|
Key Questions |
Potential Issues |
Next Steps |
Relevant Logs And Tools |
|
If a plugin, is the smart service code optimized? |
Plug-in code might not be optimized for the parameters provided |
|
|