Solved
Multi Line graph in Appian
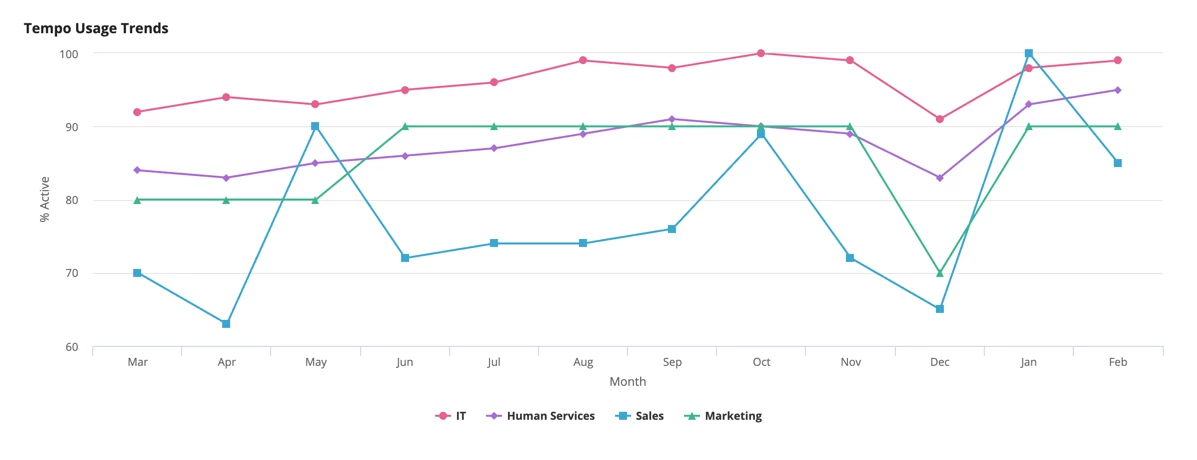
I am using the code below to show line graph for Appian. but based on our requirements , I have to show two lines instead of one line . Is it possible in Appian ?
If so , Could you please let me know how to do it ?
a!cardLayout( contents: { a!localVariables( a!lineChartField( label: "Average Days to Complete Verification Phases", instructions: "", categories: {"Mar", "Apr", "May", "Jun", "Jul", "Aug", "Sep", "Oct", "Nov", "Dec", "Jan", "Feb"}, series: { a!chartSeries(label: "Sales", data: {72, 91, 93, 95, 92, 99, 98, 99, 79, 83, 90, 99}) } ) ) }, marginBelow: "EVEN_LESS", showShadow: true() ),