
Question
Waterfall Chart
Has anyone ever done a waterfall chart in Appian?
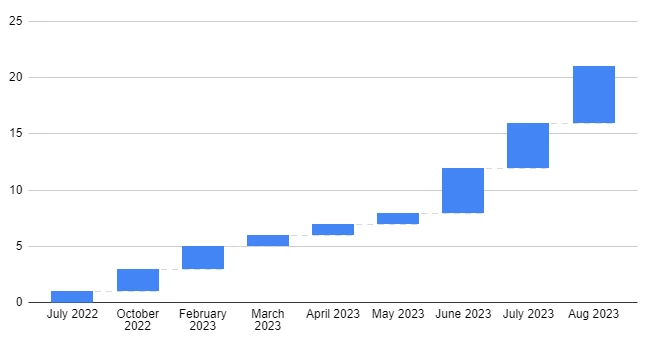
Something like this, where the value of the following month starts at the point in the Y axis where the previous month ended.

Has anyone ever done a waterfall chart in Appian?
Something like this, where the value of the following month starts at the point in the Y axis where the previous month ended.
Enter your E-mail address. We'll send you an e-mail with instructions to reset your password.