
How to Create a Dynamic Grid with Month-Year Columns Based on Date Range selection in Appian?
Hi Community,
I’m working on a requirement where I need to create dynamic columns in read-only grid in Appian and would appreciate some guidance.
Problem Statement:
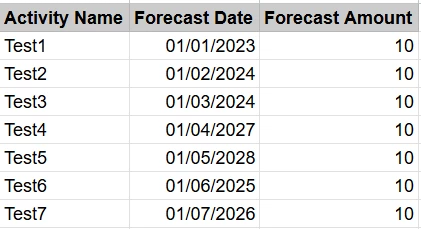
I have a database table with the following columns:
-
ActivityName
-
ForecastDate (Date field)
-
ForecastAmount (Decimal)
Requirement:
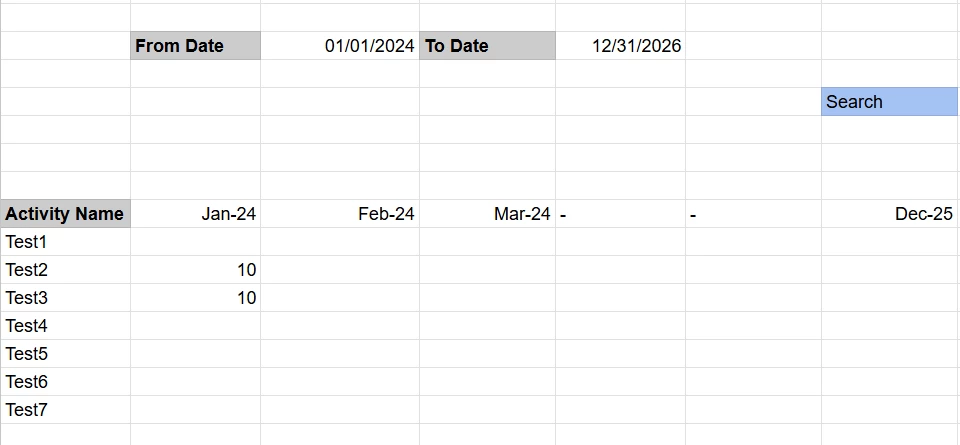
I want to display a grid where:
-
Each row represents an ActivityName.
-
Columns dynamically represent Month-Year values (like Jan-2025, Feb-2025, etc.), based on the date range selected from interface.
-
Each cell should show the corresponding ForecastAmount for that activity and month, if available.
So the table should “pivot” the data such that ForecastDate drives the column structure dynamically.
Note: Any Date range between 2020 to 2030 can be selected and searched.
Questions:
-
What’s the best approach to dynamically generate these month-year columns in an Appian interface?
-
Should I preprocess the data in an expression rule or CDT before passing it to the grid?
-
Any examples, ideas, or plug-ins that might help achieve this?
Any help or guidance would be highly appreciated!
Thanks in advance,