
manjit.1486
April 15, 2024
Question

Column Chart

  • April 15, 2024
  • 14 replies
  • 0 views

Hello,

Can anyone help me in this:

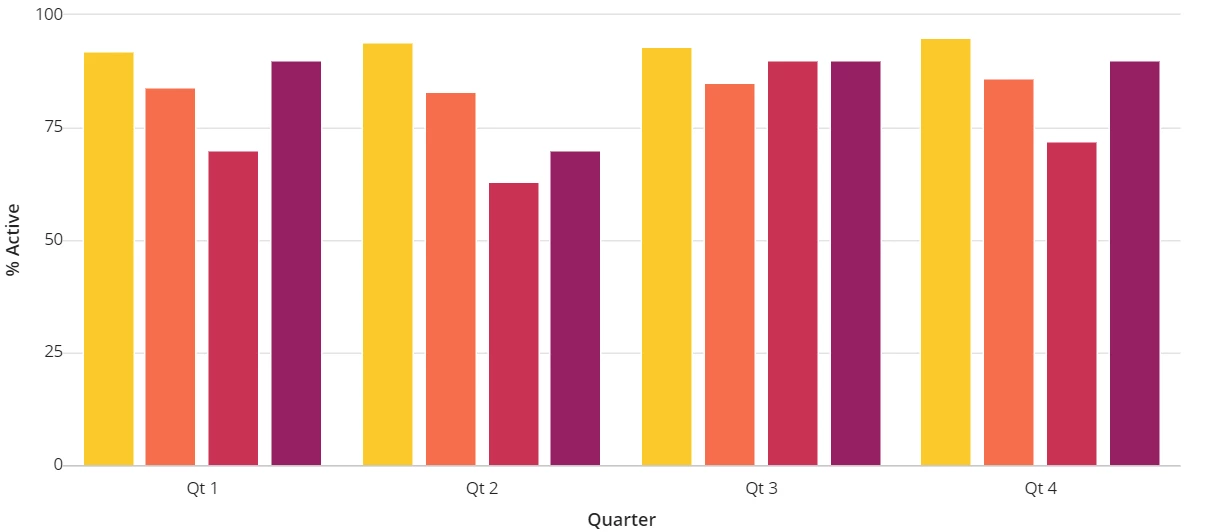
How to hide these categories text(Qt1, Qt2, Qt3, Qt4) from column chart?

Also, numbers/range(0-100) from y axis column?

Note: For this column chart configuration, I am using records.


Thanks

14 replies

April 15, 2024

You can keep xAxisStyle and yAxisStyle as "NONE" to hide these labels.

konduruc733182
April 15, 2024

Hello [mention:734d485eba7242aeab9bb03aafa409b0:e9ed411860ed4f2ba0265705b8793d05] 

How would you identify what columns refer to what category if you are getting rid of the labels?

anyway this is how you get rid of those.

manjit.1486
April 15, 2024

Thanks for the prompt response. I was trying using the same but it cause some issues. However, it's working now.

Actually, It is a requirement to not to show the labels. I was using label heading of column chart with filters of what I want to show in a result.

manjit.1486
April 15, 2024

I actually need to show like this.

karumurua531442
April 15, 2024

Hi [mention:734d485eba7242aeab9bb03aafa409b0:e9ed411860ed4f2ba0265705b8793d05]  You can use 

xAxisStyle (Text): Determines how to display the labels and axis separators for the X-Axis. Valid values: "STANDARD" (default), "NONE".

yAxisStyle (Text): Determines how to display the labels, axis separators, and grid lines for the Y-Axis. Valid values: "STANDARD" (default), "MINIMAL", "NONE".

to hide these data lables

manjit.1486
April 15, 2024

Okay, thanks.  Actually only yAxisStyle and xAxisStyle wasn't working before. Rest is working fine.

manjit.1486
April 19, 2024

HI [mention:3510a5189ce1477eaf2e09f5858c87e9:e9ed411860ed4f2ba0265705b8793d05] 
Could you please tell me how to hide or remove this 0 data labels from column chart?


This is basically shows zero records of categories. Please suggest..