October 20, 2022
Solved

column chart

  • October 20, 2022
  • 1 reply
  • 0 views

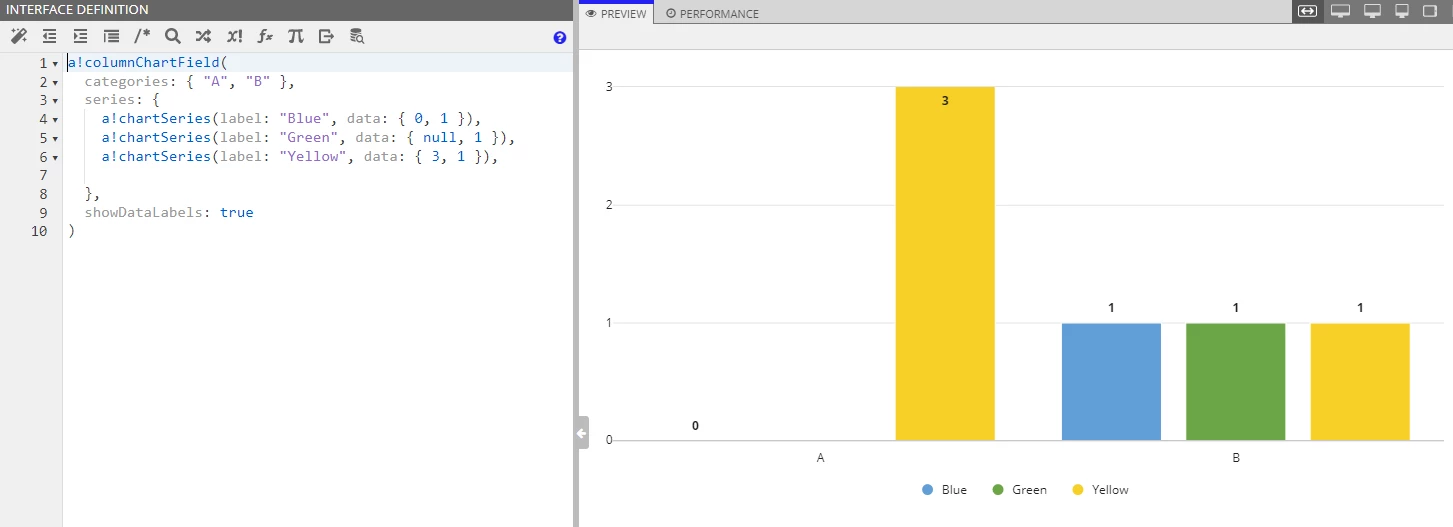
In column chart the label above the column shows a number. The problem is for the empty one it shows zero and I want it to show nothing for Zero.

How to do that.

    Best answer by daniell

    When "showDataLabels" is set to true, it will show the data values above each column. If the value of your data point is 0 it will show 0, but if instead the value is "null", then it will show nothing. However in my opinion it's easier to see and understand what's going on in the chart with the 0 value.

    .

    1 reply

    daniell
    daniellAnswer
    October 20, 2022

    When "showDataLabels" is set to true, it will show the data values above each column. If the value of your data point is 0 it will show 0, but if instead the value is "null", then it will show nothing. However in my opinion it's easier to see and understand what's going on in the chart with the 0 value.

    .