Question
Column chart Implemention
Hi team,
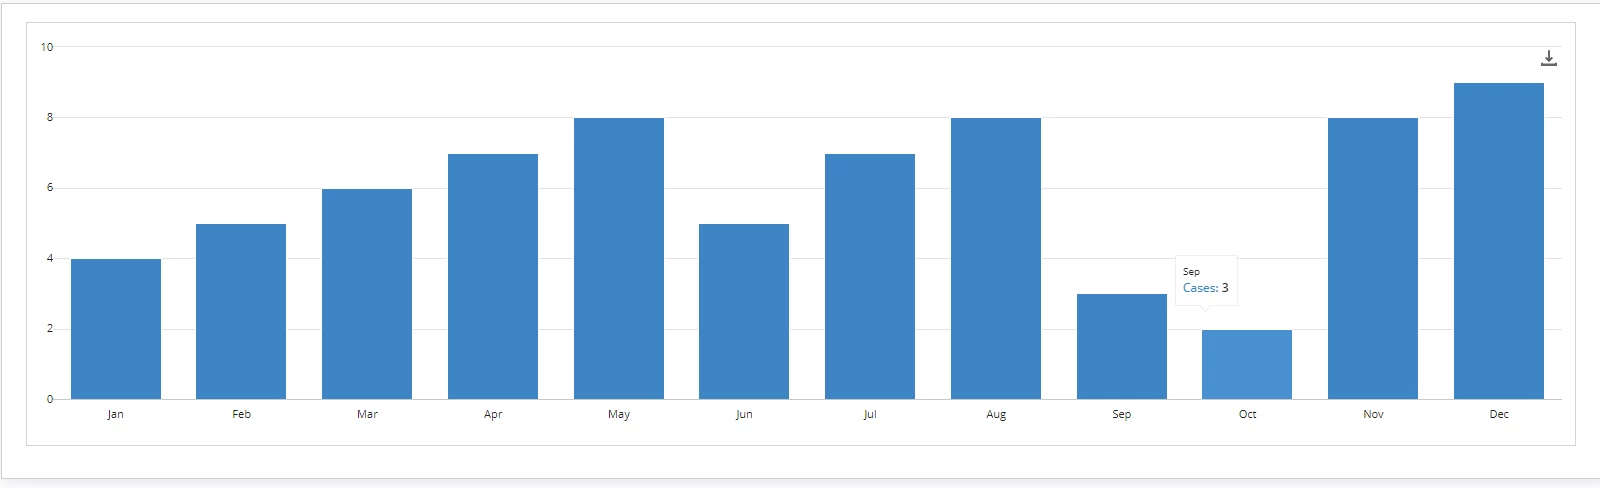
i have requirement to implement of column chart to show number of cases created with in the year,
by highlighting the current month with different color.
i couldn't able to complete logic here a!chartseries (color:?),
a!localVariables(
  local!casescountbyyear: { 4, 5, 6, 7, 8,5,7,8,3,2,8,9},
  {
    a!cardLayout(
      contents: {
        a!columnChartField(
          categories: {
            "Jan",
            "Feb",
            "Mar",
            "Apr",
            "May",
            "Jun",
            "Jul",
            "Aug",
            "Sep",
            "Oct",
            "Nov",
            "Dec"
          },
          series: {
            a!chartSeries(
              label: "Cases",
              data: local!casescountbyyear
            )
          },
          showLegend: false,
          showTooltips: true,
          allowImageDownload: true,
          colorScheme: a!colorSchemeCustom(colors: { "#3d85c6", "#9d225f",  })
        ),

      },
      height: "AUTO",
      style: "TRANSPARENT",
      marginBelow: "STANDARD",
      showBorder: true
    )
  }
)
how can show the current month in the column chart with diffrent color