

manojy0003
July 23, 2024
Solved

regarding the data , how to display the data based on the customer filter in the Appian column and bar chart

  • July 23, 2024
  • 2 replies
  • 0 views

HI All,

I need some support in the  Appian reports, wherein i trying to the display the columns charts based on the custom filter set outside of the chart configuration.Is it achievable , if so can you plz guide me the steps or the method to be followed.

thannks and regards,

manoj yadav
    Best answer by venkatrea696188

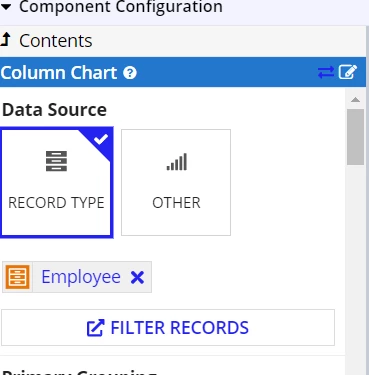
    Yup , as long as you are saving  the selected custom filter option in some variable. we can pass it through filter records.

    2 replies

    venkatrea696188
    July 23, 2024

    Yup , as long as you are saving  the selected custom filter option in some variable. we can pass it through filter records.

    konduruc733182
    July 23, 2024
    display the columns charts based on the custom filter set outside of the chart configuration

    What do you mean by this? Have you created a drop-down which works as a filter for your data? If Yes, it can be done. You need to add a filter in your record data that changes based on the value selected in the dropdown which is used for the chart.

    https://docs.appian.com/suite/help/24.1/recipe-show-total-sales-compared-to-sales-per-category.html

    Take a look at step-4