
September 30, 2024
Question

To display dynamic label in a chart
  • September 30, 2024
  • 8 replies
  • 0 views

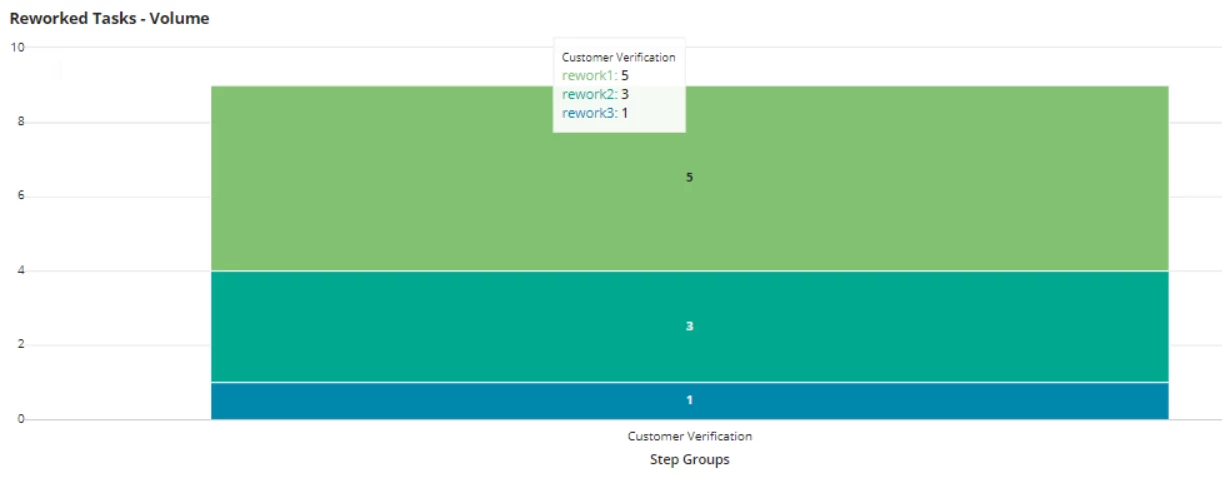
Hi Everyone, There is chart as shown above and the requirement is to have the labels displayed beside the count which is being displayed over the graph as shown below for reference.
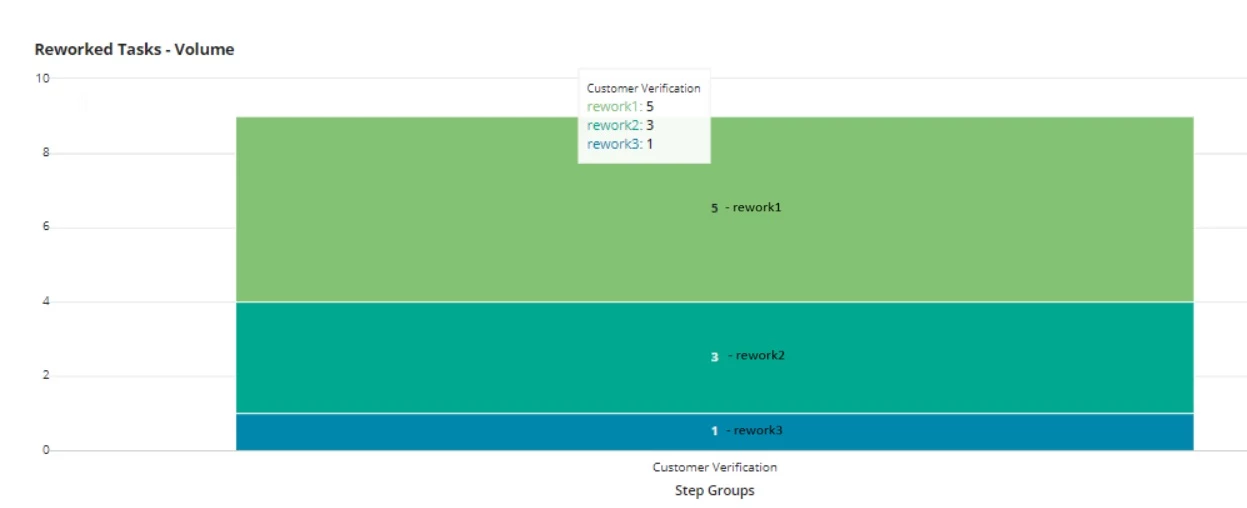
Can anyone please let me know ow can this be done?
Note: Record data was used to populate this chart

8 replies

stefanhelzle0001
September 30, 2024

This is not supported.

October 1, 2024

Hi [mention:a11f77a729fb4db2af76b09948583328:e9ed411860ed4f2ba0265705b8793d05] , Are there any alternatives to achieve something similar to this? Or are there any plug-ins?

stefanhelzle0001
October 3, 2024

There are some chart plugins available. Did you try these?

somasundaram.d
October 1, 2024

Nope, We do not have control over that

October 1, 2024

Hi [mention:57fc948ec4c44d7fbda6e5509555d197:e9ed411860ed4f2ba0265705b8793d05] , Are there any alternatives to achieve something similar to this? Or are there any plug-ins to achieve this?

somasundaram.d
October 3, 2024

There is googleColumnChartField() in the google chart component plugin which gives a lot of control over the chart. Please try it.

https://community.appian.com/b/appmarket/posts/google-charts-vuram-component

You should be able to achieve something like this