
Question
Colors in Column Chart
Hi Team, I'm currently stuck at a point and would appreciate your input. I need to display different colors for different countries in a column chart. Below is the database structure I'm working with:
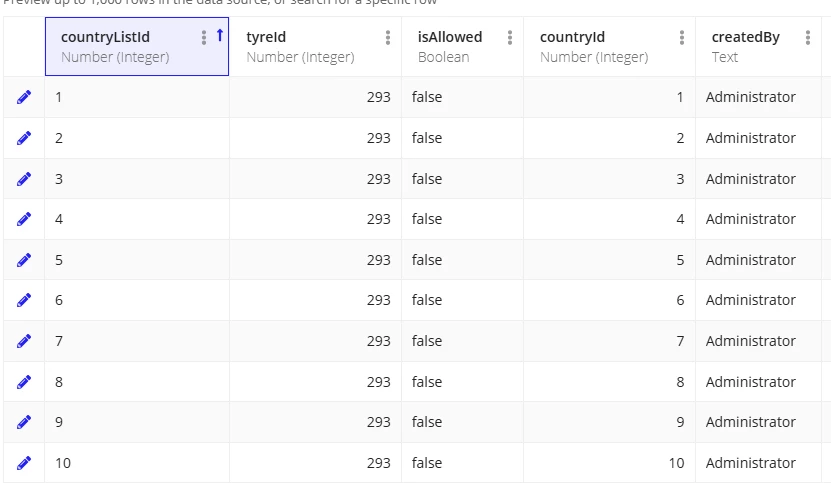
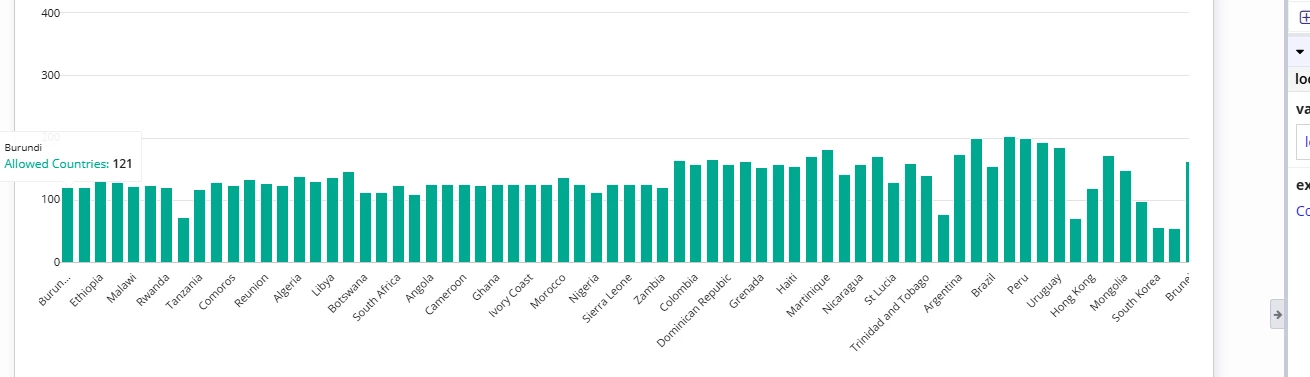
I grouped the data by countryId, and I want to display different colors for different ranges of country IDs in a column chart. For example:
- Country IDs 1, 2, 3, and 4 should be shown in blue
- Country IDs 5, 6, 7, and 8 in yellow
- Country IDs 9 and 10 in another color
These colors are just examples. If this approach is feasible, I will apply it to the actual requirement.