

venkateshg4665
May 31, 2025
Question

Colours In Column Chart

  • May 31, 2025
  • 7 replies
  • 0 views

Hi Team, I'm currently stuck at a point and would appreciate your input. I need to display different colors for different countries in a column chart. Below is the database structure I'm working with

country ListId(pK),

.countryId(int),

isAllowed(boolean)
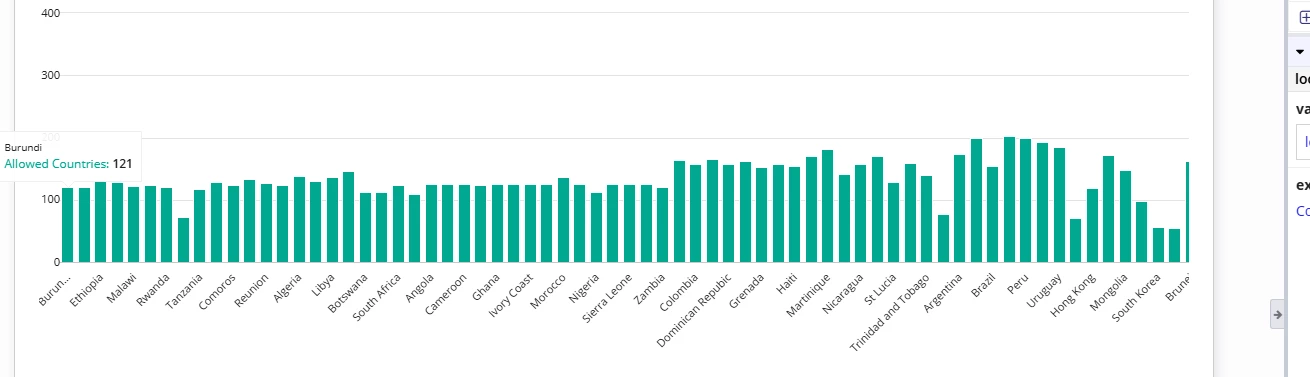
Note: I want to show only allowed countries data in column chart.

I grouped the data by countryId, and I want to display different colors for different ranges of country IDs in a column chart. For example: Country IDs 1, 2, 3, and 4 should be shown in blue Country IDs 5, 6, 7, and 8 in yellow Country IDs 9 and 10 in another color These colors are just examples. If this approach is feasible, I will apply it to the actual requirement.

7 replies

June 2, 2025

You can manage the colors by using multiple a!chartSeries() like below...

{
  a!columnChartField(
    label: "Column Chart",
    categories: {"Category 1", "Category 2", "Category 3"},
    series: {
      a!chartSeries(color: "#f0f0f0", label: "Country One", data: {1, 2, 3}),
      a!chartSeries(color: "ACCENT", label: "Country Two", data: {2, 3, 4}),
    },
    stacking: "NONE",
    showLegend: true,
    showTooltips: true,
    labelPosition: "ABOVE",
    allowImageDownload: true,
    colorScheme: "RAINFOREST",
    height: "MEDIUM",
    xAxisStyle: "STANDARD",
    yAxisStyle: "STANDARD"
  )
}

June 4, 2025

[mention:abe7c4dc1a704835a31a221efc203f54:e9ed411860ed4f2ba0265705b8793d05]  Thanks for reply, but link parameter is not working  for above code in all bars in chart.

stefanhelzle0001
June 4, 2025

What exactly do you mean with "not working", and how does you code look like?