
Question
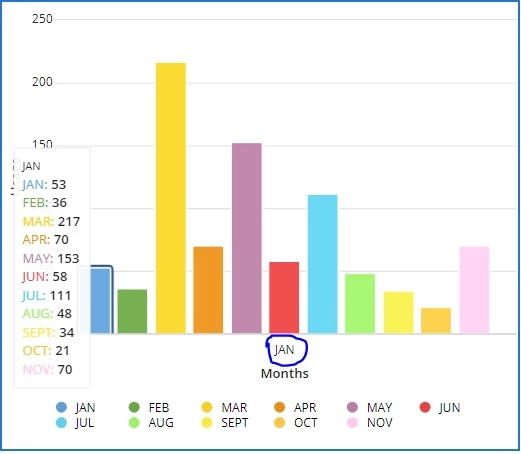
Column chart categories only showing first one.
Hello,
The categories of column char showing one 1st at its index. The column chart is as follows:
series:
  local!columnSeries:a!forEach(
    items:local!months,
    expression: a!localVariables(
      a!chartSeries(
        label: fv!item,
        data: a!localVariables(
          local!count_usage:where(local!months=cast(typeof(local!months), fv!item), 0),
          if(
            length(local!count_usage)=0,
            0,
            index(index(local!localCbProcessess.data, "id_count", {}), local!count_usage, 0)
          )
        )
      )
    )
  )
Column Chart field:
 a!columnChartField(
                          categories: local!months,
                          series: local!columnSeries,
                          xAxisTitle: "Months",
                          yAxisTitle: "Usage",
                          stacking: "NONE",
                          colorScheme: "CLASSIC"
                        )
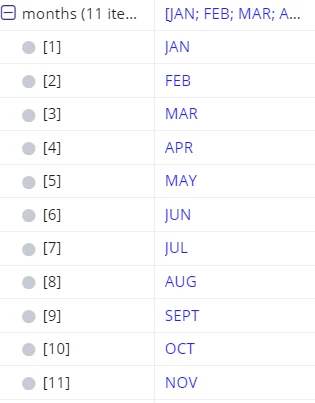
categories data sanp:
the chart is not showing all the categories
Can anyone help me out.