
February 12, 2025
Question

Column Chart Configuration in interface

  • February 12, 2025
  • 4 replies
  • 0 views

Hi Friends,

I have a requirement for an interface that consists of a column chart and a filter with top 1 and top 2 values.

I am using a record field for grouping, so it is giving 10 columns in the chart. However, when I select top 1 in the filter, I want the graph to display only 1 column. If I select top 2, I want the graph to display only the top 2 columns.

Refer below pics

Normal Pic : 
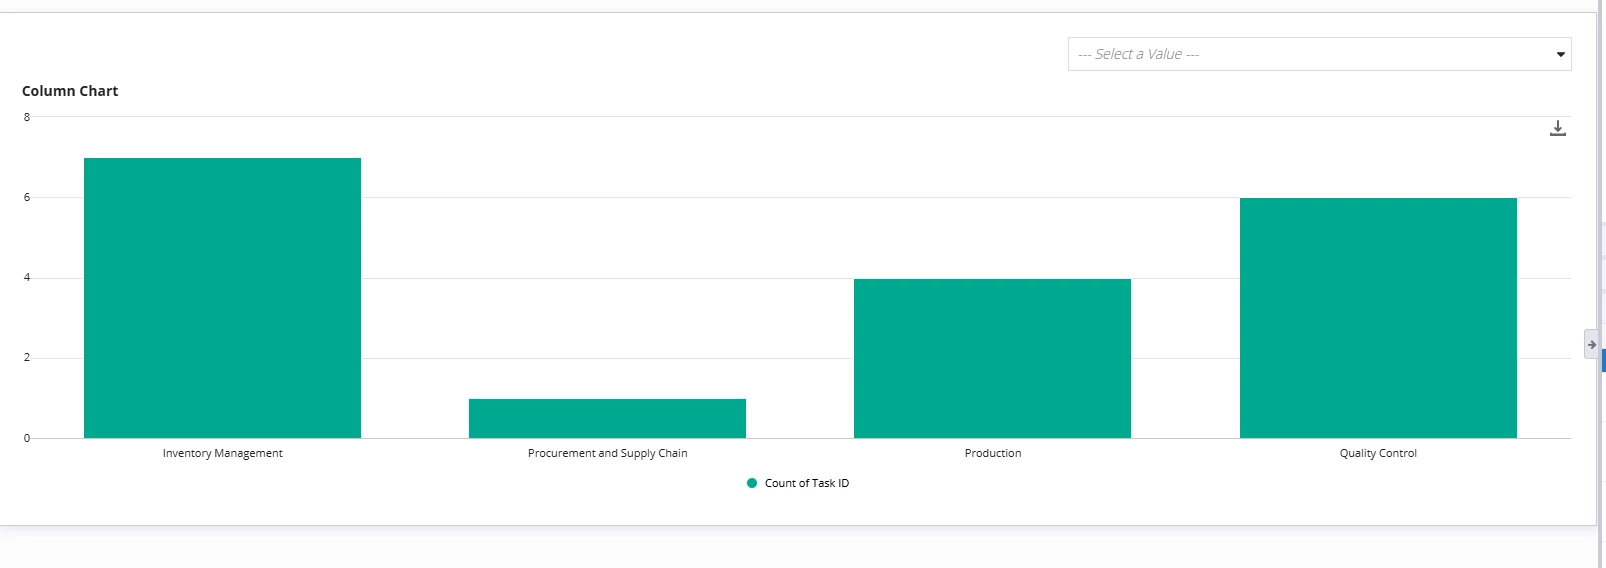
when I select top1 I want to show only inventory management in entire graph,.

When I select top2 I want to show only inventory management and Quality control columns in chart.

4 replies

stefanhelzle0001
February 12, 2025

Please share the code for this interface, and ...

konduruc733182
February 12, 2025

Hello [mention:b47709aa823c422e99c324cbdda67103:e9ed411860ed4f2ba0265705b8793d05] 

You will have to get rid of the record data from the data parameter of the column chart component and group the data in a separate local variable. Later you will have to use the series parameter of the column chart to build your column chart. 

Use the below example expression

a!localVariables(
  local!data: index(
    a!queryRecordType(
      recordType: recordType!YourRecordType,
      fields: a!aggregationFields(
        groupings: {
          a!grouping(
            field: "recordField1",
            alias: "categoryId_grouping2"
          )
        },
        measures: {
          a!measure(
            function: "COUNT",
            field: "recordField2",
            alias: "id_count_measure1"
          )
        }
      ),
      pagingInfo: a!pagingInfo(
        sort: a!sortInfo(
          field: "id_count_measure1",
          ascending: false()
        ),
        startIndex: 1,
        batchSize: 100
      )
    ).data,
    if(
      a!isNullOrEmpty(ri!ruleIn),
      {},
      enumerate(ri!ruleIn) + 1
    ),
    {}
  ),
  {
    a!dropdownField(
      choiceLabels: { "Top 1", "Top 2" },
      choiceValues: { 1, 2 },
      label: "Select",
      labelPosition: "ABOVE",
      placeholder: "--- Select a Value ---",
      value: ri!ruleIn,
      saveInto: { ri!ruleIn },
      searchDisplay: "AUTO",
      validations: {}
    ),
    a!columnChartField(
      label: "Column Chart",
      categories: {},
      series: {
        a!chartSeries(data: local!data.id_count_measure1)
      },
      stacking: "NONE",
      showLegend: true,
      showTooltips: true,
      labelPosition: "ABOVE",
      allowImageDownload: true,
      colorScheme: "RAINFOREST",
      height: "MEDIUM",
      xAxisStyle: "STANDARD",
      yAxisStyle: "STANDARD",
      refreshAfter: "RECORD_ACTION"
    )
  }
)

komalj3844
February 12, 2025

Hi [mention:b47709aa823c422e99c324cbdda67103:e9ed411860ed4f2ba0265705b8793d05] 

posting on behalf of [mention:2df2892a4df7486f9775b4d2f0e405fd:e9ed411860ed4f2ba0265705b8793d05] 

Here is the solution for your issue 

a!localVariables(

  local!data:index(

    a!queryRecordType(

      recordType:,

      fields: a!aggregationFields(

        groupings: {

          a!grouping(

            field:,

            alias: "categoryId_grouping2"

          )

        },

        measures: {

          a!measure(

            function: "COUNT",

            field: ,

            alias: "id_count_measure1"

          )

        }

      ),

      pagingInfo: a!pagingInfo(

        sort: a!sortInfo(

          field: "id_count_measure1",

          ascending: false()

        ),

        startIndex: 1,

        batchSize: 100

      )

    ).data,

    if(

      a!isNullOrEmpty(ri!ruleIn),

      {},

      enumerate(ri!ruleIn) + 1

    ),

    {}

  ),

  {

    a!dropdownField(

      choiceLabels: {"Top 1","Top 2"},

      choiceValues: {1, 2},

      label: "Select",

      labelPosition: "ABOVE",

      placeholder: "--- Select a Value ---",

      value: ri!ruleIn,

      saveInto: {ri!ruleIn},

      searchDisplay: "AUTO",

      validations: {}

    ),

    a!columnChartField(

      label: "Column Chart",

      categories: {local!data.categoryId_grouping2},

      series: {a!chartSeries(data:local!data.id_count_measure1)},

      stacking: "NONE",

      showLegend: true,

      showTooltips: true,

      labelPosition: "ABOVE",

      allowImageDownload: true,

      colorScheme: "RAINFOREST",

      height: "MEDIUM",

      xAxisStyle: "STANDARD",

      yAxisStyle: "STANDARD",

      refreshAfter: "RECORD_ACTION"

    )

  }

)

February 12, 2025

Thank you Komal Jain and Chaitanya ,It is working as expected.