

dinesha5713
January 2, 2025
Solved

GridField Dynamic Column
  • January 2, 2025
  • 1 reply
  • 0 views


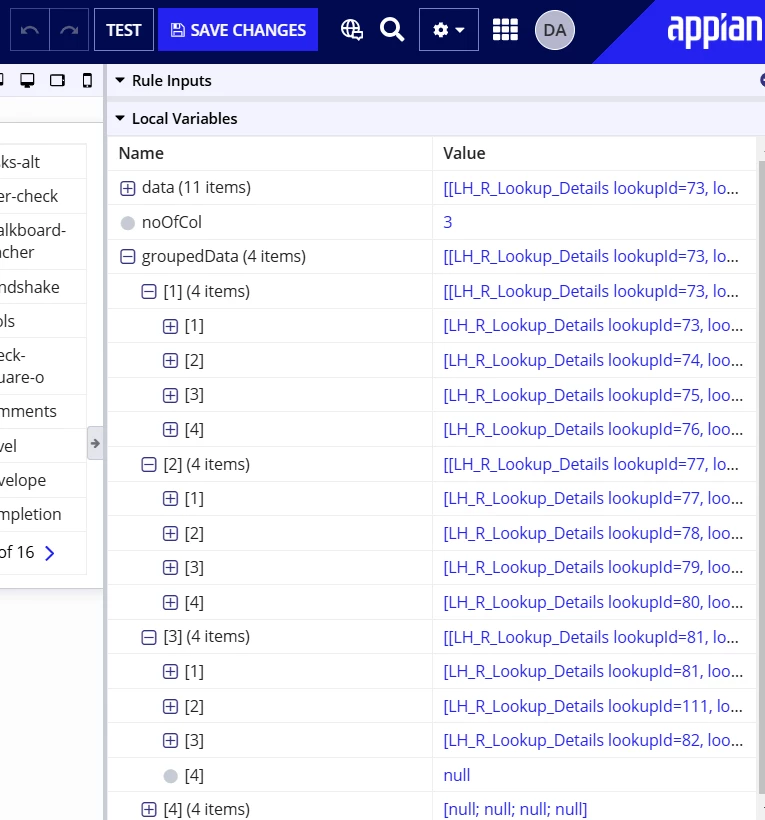
This is the code i wrote 
my requirement is to

im fetching the data's from DB 

lets say i have 11 data in total ,

i need it in a dynamic column in gridField like (no of col can be : 2,4,6)

local!data : DB datas,

local!noOfCol : (3,4,5) -> any number (const),

so based on the col number the total number of data have to be grouped and run in the loop


in a gridField using GridColumn i need to run the loop 


the data should be look like this in the ICON wise.
it is done in Columns layout
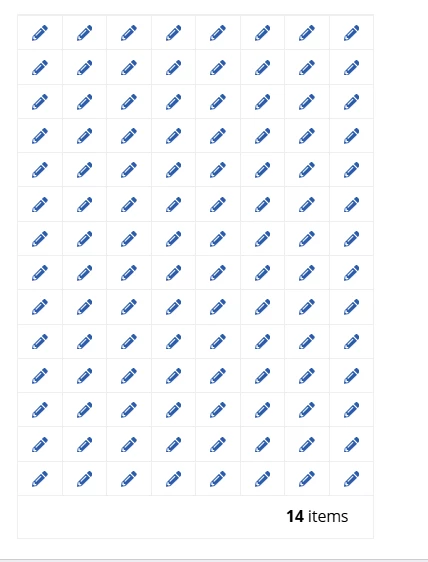


expample 

local!a : { {1,2,3,4} ,{5,6,7,8},{9,0}},

output in gridColumn in Left to Right

1 2 3 4

5 6 7 8

9 0 null null

Code 

a!localVariables(
local!data: rule!LH_QRC_getLookupDetailsByFilters(categoryList: "ICON"),
local!noOfCol: 4,
local!groupedData: a!forEach(
items: enumerate(
ceiling(count(local!data) / local!noOfCol)
),
expression: index(
local!data,
enumerate(4) + (((fv!index - 1) * 4) + 1),
null
)
),
a!gridField(
data: local!groupedData,
columns: a!forEach(
items: local!groupedData,
expression: a!gridColumn(
value: a!richTextDisplayField(
value: a!richTextItem(
text: fv!row['recordType!{3bb16dda-7da2-4cd8-98b9-03f91f7166f3}LH_R_Lookup_Details.fields.{26a951a2-97dd-460f-9861-e1023cfc2bdc}displayLabel']
)
)
)
),
spacing: "DENSE",
borderStyle: "STANDARD",
shadeAlternateRows: false
)
)

Can anyone help with the logic

Best answer by keshavd5650

Hi Dinesh,

I've made some updates to your code to dynamically group the data into columns based on a configurable number of columns (e.g., 2, 4, or 6). These changes should help render the grid as you need.

Here’s the updated code.

a!localVariables(
  local!data: {
    {lookupId: 1, displayLabel: "dove"},
    {lookupId: 2, displayLabel: "download"},
    {lookupId: 3, displayLabel: "drafting-compass"},
    {lookupId: 4, displayLabel: "dragon"},
    {lookupId: 5, displayLabel: "draw-polygon"},
    {lookupId: 6, displayLabel: "drum"},
    {lookupId: 7, displayLabel: "drum-steelpan"},
    {lookupId: 8, displayLabel: "drumstick-bite"},
    {lookupId: 9, displayLabel: "dumbbell"}
  },
  local!noOfCol: 3,
  local!groupedData: a!forEach(
    items: enumerate(
      ceiling(count(local!data) / local!noOfCol)
    ),
    expression: reduce(
      a!update,
      a!map(),
      merge(
        a!forEach(items: enumerate(local!noOfCol),expression: concat("item",fv!index)),
        index(
          local!data,
          enumerate(local!noOfCol) + (((fv!index - 1) * local!noOfCol) + 1),
          null
        )
      )
    )
  ),
  a!gridField(
    label: "Icons",
    labelPosition: "COLLAPSED",
    data: local!groupedData,
    columns: a!forEach(
      items: enumerate(local!noOfCol),
      expression: a!gridColumn(
        label: concat("Col ",fv!index),
        value: a!richTextDisplayField(
          label: "Lookup Icons",
          labelPosition: "COLLAPSED",
          value: a!richTextIcon(
            icon: index(
              index(fv!row,concat("item",fv!index),null),
              "displayLabel",
              null
            ),
            size: "MEDIUM"
          )
        ),
        align: "CENTER"
      )
    ),
    spacing: "DENSE",
    borderStyle: "STANDARD",
    shadeAlternateRows: false
  )
)


Let me know whether my understanding is correct!

1 reply

keshavd5650
January 7, 2025

Hi Dinesh,

I've made some updates to your code to dynamically group the data into columns based on a configurable number of columns (e.g., 2, 4, or 6). These changes should help render the grid as you need.

Here’s the updated code.

a!localVariables(
  local!data: {
    {lookupId: 1, displayLabel: "dove"},
    {lookupId: 2, displayLabel: "download"},
    {lookupId: 3, displayLabel: "drafting-compass"},
    {lookupId: 4, displayLabel: "dragon"},
    {lookupId: 5, displayLabel: "draw-polygon"},
    {lookupId: 6, displayLabel: "drum"},
    {lookupId: 7, displayLabel: "drum-steelpan"},
    {lookupId: 8, displayLabel: "drumstick-bite"},
    {lookupId: 9, displayLabel: "dumbbell"}
  },
  local!noOfCol: 3,
  local!groupedData: a!forEach(
    items: enumerate(
      ceiling(count(local!data) / local!noOfCol)
    ),
    expression: reduce(
      a!update,
      a!map(),
      merge(
        a!forEach(items: enumerate(local!noOfCol),expression: concat("item",fv!index)),
        index(
          local!data,
          enumerate(local!noOfCol) + (((fv!index - 1) * local!noOfCol) + 1),
          null
        )
      )
    )
  ),
  a!gridField(
    label: "Icons",
    labelPosition: "COLLAPSED",
    data: local!groupedData,
    columns: a!forEach(
      items: enumerate(local!noOfCol),
      expression: a!gridColumn(
        label: concat("Col ",fv!index),
        value: a!richTextDisplayField(
          label: "Lookup Icons",
          labelPosition: "COLLAPSED",
          value: a!richTextIcon(
            icon: index(
              index(fv!row,concat("item",fv!index),null),
              "displayLabel",
              null
            ),
            size: "MEDIUM"
          )
        ),
        align: "CENTER"
      )
    ),
    spacing: "DENSE",
    borderStyle: "STANDARD",
    shadeAlternateRows: false
  )
)


Let me know whether my understanding is correct!