
September 9, 2021
Question

Highlighting or indicating a data point in a lineChartField based on X axis value

  • September 9, 2021
  • 6 replies
  • 0 views

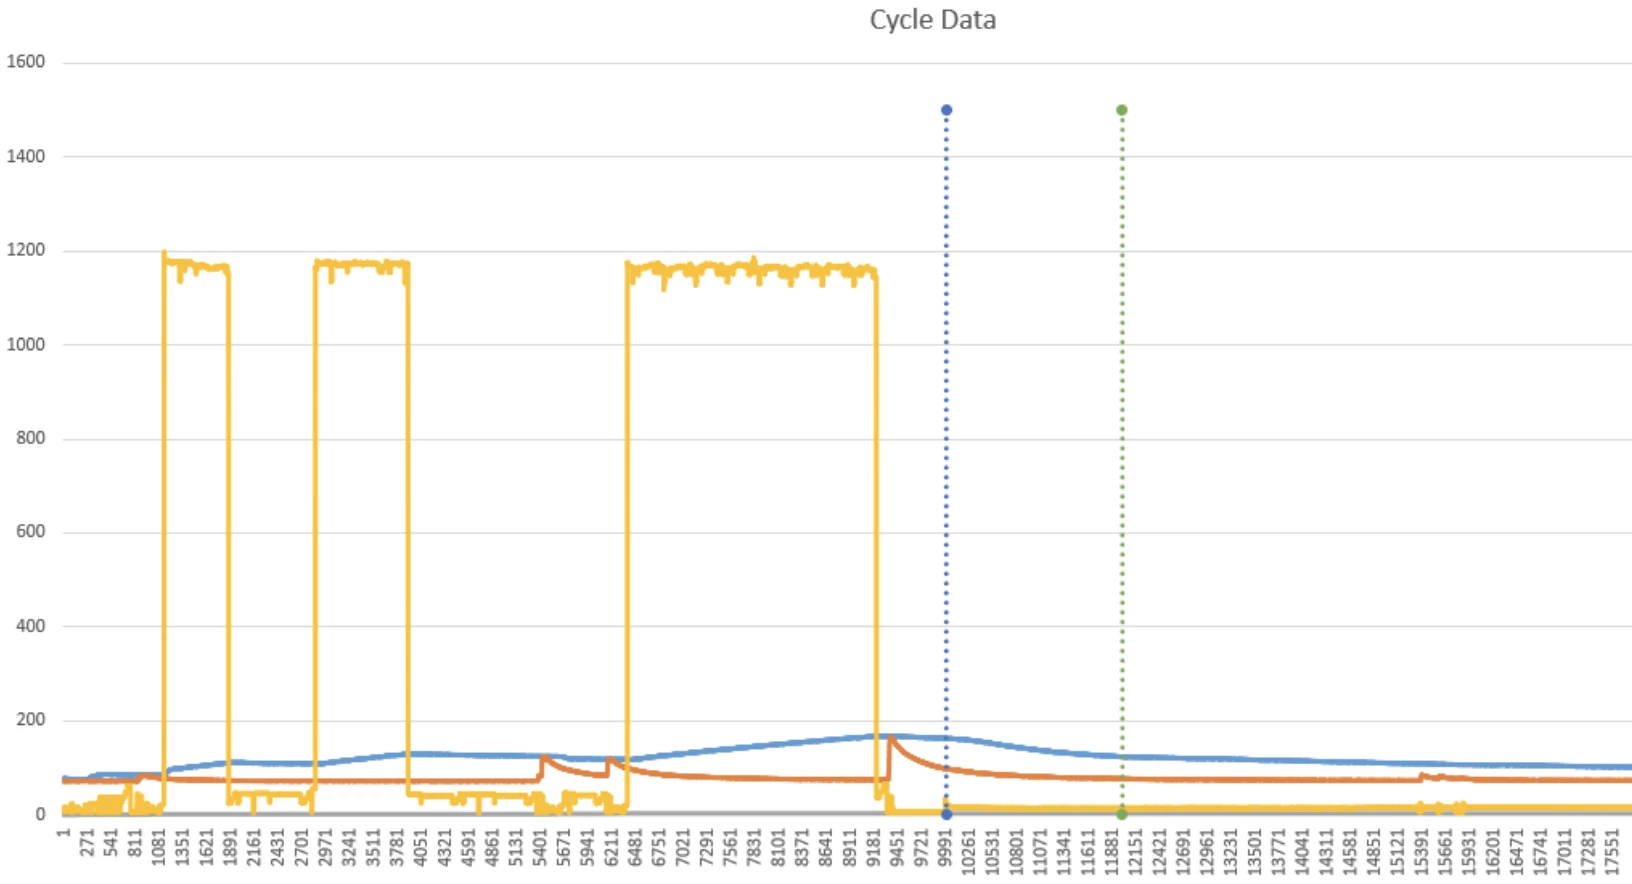
I have a scenario where I need to somehow indicate in a lineChartField when a specific value on the X axis is selected.  Basically I need a chartReferenceLine, but on the X axis.  I have attached a photo as an example.  
6 replies

gabriele.camilli
September 10, 2021

Hello!

Have you thought of using a fake distribution? one chart series that is 0 everywhere except on the x values required?

It could work in your case because you seem to have a lot of values and your distribution start at 0

Tell me if it could work, else i will think of something else

September 13, 2021

Hi Gabriele 

for your idea not able to have a straight vertical line

September 13, 2021

I agree, I have not been able to create a straight line