

Inverting x axis on line chart component
I'm creating a line chart where I want to display a sum of transaction amounts per last 6 months.
The expression for the linechart component is the following:
a!lineChartField(
  data: 'recordType!{2e778cbc-bcd7-48a6-bda3-2f52ac5e15d0}W0592PF Transaction',
  config: a!lineChartConfig(
    primaryGrouping: a!grouping(
      field: 'recordType!{2e778cbc-bcd7-48a6-bda3-2f52ac5e15d0}W0592PF Transaction.fields.{012826cc-c147-43c8-8171-e9c1cc8990bd}date',
      alias: "date_month_primaryGrouping",
      interval: "MONTH_SHORT_TEXT"
    ),
    measures: {
      a!measure(
        function: "SUM",
        field: 'recordType!{2e778cbc-bcd7-48a6-bda3-2f52ac5e15d0}W0592PF Transaction.fields.{53db9671-69f5-4d88-b573-89f591e99754}amount',
        alias: "amount_sum_measure1",
        formatValue: "DOLLAR"
      )
    },
    sort: {
      a!sortInfo(
        field: "date_month_primaryGrouping",
        ascending: false
      )
    },
    dataLimit: 6,
    showIntervalsWithNoData: false
  ),
  label: "Line Chart",
  labelPosition: "ABOVE",
  xAxisTitle: "Month",
  yAxisTitle: "Amount spent",
  showLegend: false,
  showTooltips: true,
  allowImageDownload: true,
  colorScheme: "RAINFOREST",
  height: "MEDIUM",
  xAxisStyle: "STANDARD",
  yAxisStyle: "STANDARD",
  refreshAfter: "RECORD_ACTION"
)
What I keep seeing is that if I sort the data on descending (which is what I need since I want to show the LAST 6 months) is that the chart will show the months going from right to left, and I would want them to show from left to right which would be easier for a user to read.
Here's the generated chart:
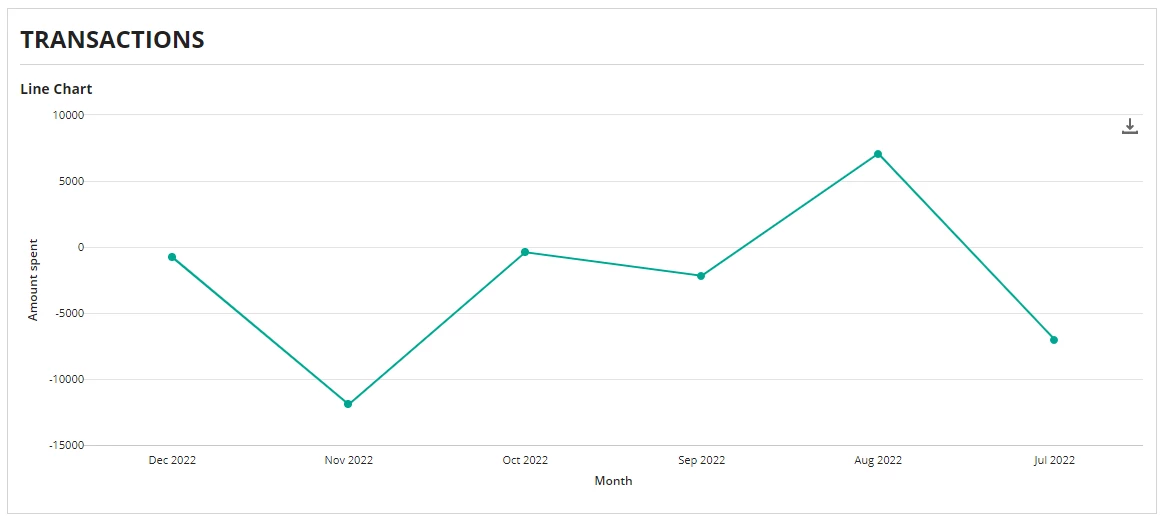
Sorting in the ascending order changes the orientation but since I'm limiting the data to 6 rows it's not working correctly (it will cut off any months that come after the 6th one).
I'm guessing that there is some way to invert the X axis which would probably be the easiest solution to achieve this but I cannot seem to find how to do that.
Any suggestions?
Thanks.