

Is it possible to separate numerical data on the Y axis of a line graph into 3-digit increments?(折れ線グラフのY軸の数値データを3桁区切りにすることは可能でしょうか)
I am always indebted. We would like to consult with you all.
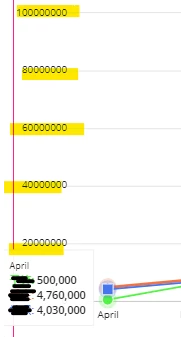
Currently, the line graph in the interface represents the change in amount.
Is there a way to express the amount (numeric value) on the Y-axis in 3-digit increments?
I would like to express it like "10000" → "10,000" on the Y axis as well.
You can see detailed amounts in 3-digit increments by hovering over the graph, this is Appian's default feature.
The Y-axis value is linked to the displayed data. Even if I passed the display data separated by 3 digits, there was no change on the Y axis. Is it not possible?
If anyone knows, I would appreciate your advice.
Thank you.
いつもお世話になっています。皆様にご相談があります。
現在、インターフェースの折れ線グラフで、金額の推移を表現しています。
Y軸の金額(数値)を3桁区切りで表現する方法はありますでしょうか?
Y軸にも「10000」→「10,000」のように表現したいです。
グラフをマウスオーバーすると3桁区切りで詳細金額を見ることができます、これはAppianのデフォルト機能です。
Y軸の値は表示データに連動しています。表示データを3桁区切りにした状態で渡してもY軸に変化はありませんでした。実現不可能なのでしょうか?
もしご存じの方が居られましたら、ご助言いただきたく存じます。
よろしくお願いいたします。