
November 13, 2024
Question

Stack Column Chart with Data Type

  • November 13, 2024
  • 3 replies
  • 0 views

Hi,

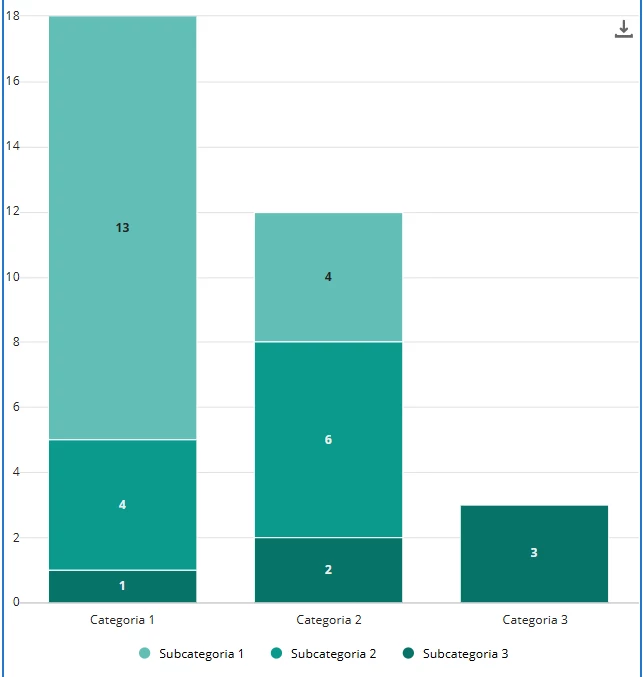
I would like to know how to create this type of Chart (with stacking) using a Data Type. It's really easy using records but I'm practicing using ctds and I can't figure out how to create this.

My data type has two parameter, Category and Subcategory, and I want the chart to show for each category, how many subcategories of each are there. Hope the image is more clear than my explanation.

Thanks.
3 replies

stefanhelzle0001
November 13, 2024
November 13, 2024

Yes but in this examples, the data is written directly on the chart series and I what I want is to access the data store and get the value of the category and subcategory parameters of each entry of the custom data type. That's where my problem is, I don't know how to query correctly the data I need and configure the chart. What I want to do is what you achieve using Records with the primary and secondary groupings.
 

stefanhelzle0001
November 13, 2024

Using queryEntity, you can easily group and aggregate your data.

https://docs.appian.com/suite/help/24.3/fnc_system_a_query.html