
March 3, 2023
Question

User Interface

  • March 3, 2023
  • 5 replies
  • 0 views

Hello All,

I have a requirement that, this type of grid has to be shown(each row has different mapping), the existing structure has the card layout on top of that how this can be done?
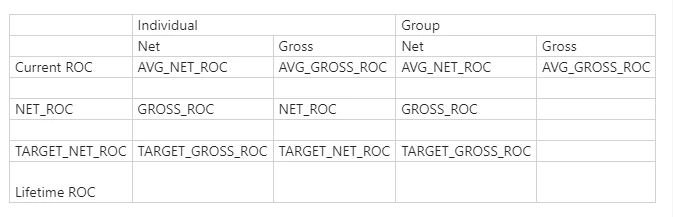
 

Let me once if anyone can find out solution or idea on this.

Thanks in advance.

    5 replies

    March 3, 2023

    Can Anyone suggest, how this can be done using grid or however?

    stefanhelzle0001
    Brainy
    March 3, 2023

    A combination of columns layouts and grid layouts should do it. What did you try so far?

    March 3, 2023

    As Stefan mentioned you can achieve this using grid layouts and column layout.

    March 6, 2023

    okay thanks Stefan Helzle and Naresh

    shukurs2366
    March 6, 2023

    a!localVariables(
      local!data: {
        {
          key1: "Current ROC",
          key2: "AVG_NET_ROC",
          Key3: "AVG_GROSS_ROC"
        },
        {
          key1: " ",
          key2: "AVG_NET_ROC",
          key3: "NET_ROC"
        },
        {
          key1: "NET ROC",
          key2: "AVG_NET_ROC",
          key3: "TARGET_NET_ROC"
        }
      },
      {
        a!columnsLayout(
          columns: {
            a!columnLayout(
              contents: {
                a!richTextDisplayField(value: a!richTextItem(text: " ")),
                a!gridField(
                  data: local!data,
                  columns: {
                    a!gridColumn(label: " -", value: fv!row.key1)
                  }
                )
              },
              width: "NARROW"
            ),
            a!columnLayout(
              contents: {
                a!richTextDisplayField(
                  value: a!richTextItem(text: "Individual")
                ),
                a!gridField(
                  data: local!data,
                  columns: {
                    a!gridColumn(label: "Net ", value: fv!row.key2),
                    a!gridColumn(label: " Gross", value: fv!row.key3)
                  }
                )
              }
            ),
            a!columnLayout(
              contents: {
                a!richTextDisplayField(
                  value: a!richTextItem(text: "Group")
                ),
                a!gridField(
                  data: local!data,
                  columns: {
                    a!gridColumn(label: "Net ", value: fv!row.key2),
                    a!gridColumn(label: " Gross", value: fv!row.key3)
                  }
                )
              }
            )
          },
          showDividers: true()
        )
      }
    )